Double digits: Server market enjoys its best ever year as 'white box' sales surge

By Ian Scales
Sep 7, 2018
")
via Flickr © ion-bogdan dumitrescu (CC BY 2.0)
- Vendor revenues in the server market have increased by 43.7 per cent
- IDC says the overall server market continues to experience ‘historic demand’
- ODMs constructing ‘white box’ servers to equip the hyperscale data centers has a lot to do with it
Is the overall IT market transforming in the way we’re meant to believe it is? Is everything migrating to the cloud; are so-called white box servers starting to predominate in the increasingly hyperscale data centre environment and is virtualized telco infrastructure following the data onto public cloud facilities?
The latest global server numbers from IDC indicate that that is exactly what’s going on. In this market and current business environment it’s not often that you see double digit anything, but in boring old servers, guess what?
Doubling those digits
IDC has been running the numbers for its Worldwide Quarterly Server Tracker, and finds that vendor revenue in the worldwide server market increased by an enviable 43.7 per cent, year over year to $22.5 billion during the second quarter of this year. Actual worldwide server shipments increased 20.5 per cent year over year to 2.9 million units in 2Q18.
This, says IDC, is the overall server market continuing to experience ‘historic demand’ with 2Q18 marking the fourth consecutive quarter of double digit revenue growth and its highest total revenue ever. Volume server revenue increased by 42.7% to $18.4 billion, while midrange server revenue grew 63.0% to $2.5 billion. High-end systems grew 30.4% to $1.7 billion.
"The worldwide server market continues to flourish amid a market-wide enterprise refresh cycle and increasing demand from cloud service providers," says Sanjay Medvitz, senior research analyst, Servers and Storage at IDC. "Enterprises continue to invest in new infrastructure to support next-generation applications and achieve cloud-like benefits on premise. Server revenue growth has also been driven by increasing average selling prices (ASPs). This is due to richer configurations, DRAM prices, and new processor platforms."
But perhaps the most profound impact is from the so-called ‘Hyperscalers’ who, says Medvitz, continue to update and expand their datacenter presence.
Market disruption
Hyperscale data builders are in the process of upending the server market. Observers note that where before the competitive worry within this segment was that it would end up with too few OEMs to maintain its essential cut-throat price and feature competition. That’s the dynamic that keeps the whole Web Scale growth story on the road: lower infrastructure costs leading to cheaper storage, leading to more ambitious online business models, leading to more digital growth and so on. Now, they say, we face the prospect of there being just a few big buyers who are already distorting the market with their buying power, making it far cheaper for enterprises to share that buying power by putting their data in the cloud, rather than by buying ‘branded’ servers.
For unless an enterprise is humongously large, it can’t get anywhere near the buying power that would enable it to tap the so called ODMs - the Original Design manufacturers that are feeding servers to the Amazons, Googles, Apples and Microsofts of the world.
ODMs construct the so-called ‘white box’ servers - vanilla servers built out of Commercial Off The Shelf (COTS) components and built at scale and at rock-bottom prices. In addition to equipping the hyperscale data centers, white boxes can support the virtualisation, cloud native software that the telecoms and networking industries are targeting for their digital transformation.
The full global server market details are below in the original IDC press release
Worldwide server market revenue grew 43.7% year over year to a record $22.5 billion during the second quarter of 2018, according to IDC
FRAMINGHAM, Mass., September 5, 2018 – According to the International Data Corporation (IDC) Worldwide Quarterly Server Tracker, vendor revenue in the worldwide server market increased 43.7%, year over year to $22.5 billion during the second quarter of 2018 (2Q18). Worldwide server shipments increased 20.5% year over year to 2.9 million units in 2Q18.
The overall server market continues to experience historic demand with 2Q18 marking the fourth consecutive quarter of double digit revenue growth and its highest total revenue ever. Volume server revenue increased by 42.7% to $18.4 billion, while midrange server revenue grew 63.0% to $2.5 billion. High-end systems grew 30.4% to $1.7 billion.
"The worldwide server market continues to flourish amid a market-wide enterprise refresh cycle and increasing demand from cloud service providers," said Sanjay Medvitz, senior research analyst, Servers and Storage at IDC. "Enterprises continue to invest in new infrastructure to support next-generation applications and achieve cloud-like benefits on premise. Hyperscalers also continue to update and expand their datacenter presence, benefiting ODM Direct suppliers. Server revenue growth has also been driven by increasing average selling prices (ASPs). This is due to richer configurations, DRAM prices, and new processor platforms."
Overall Server Market Standings, by Company
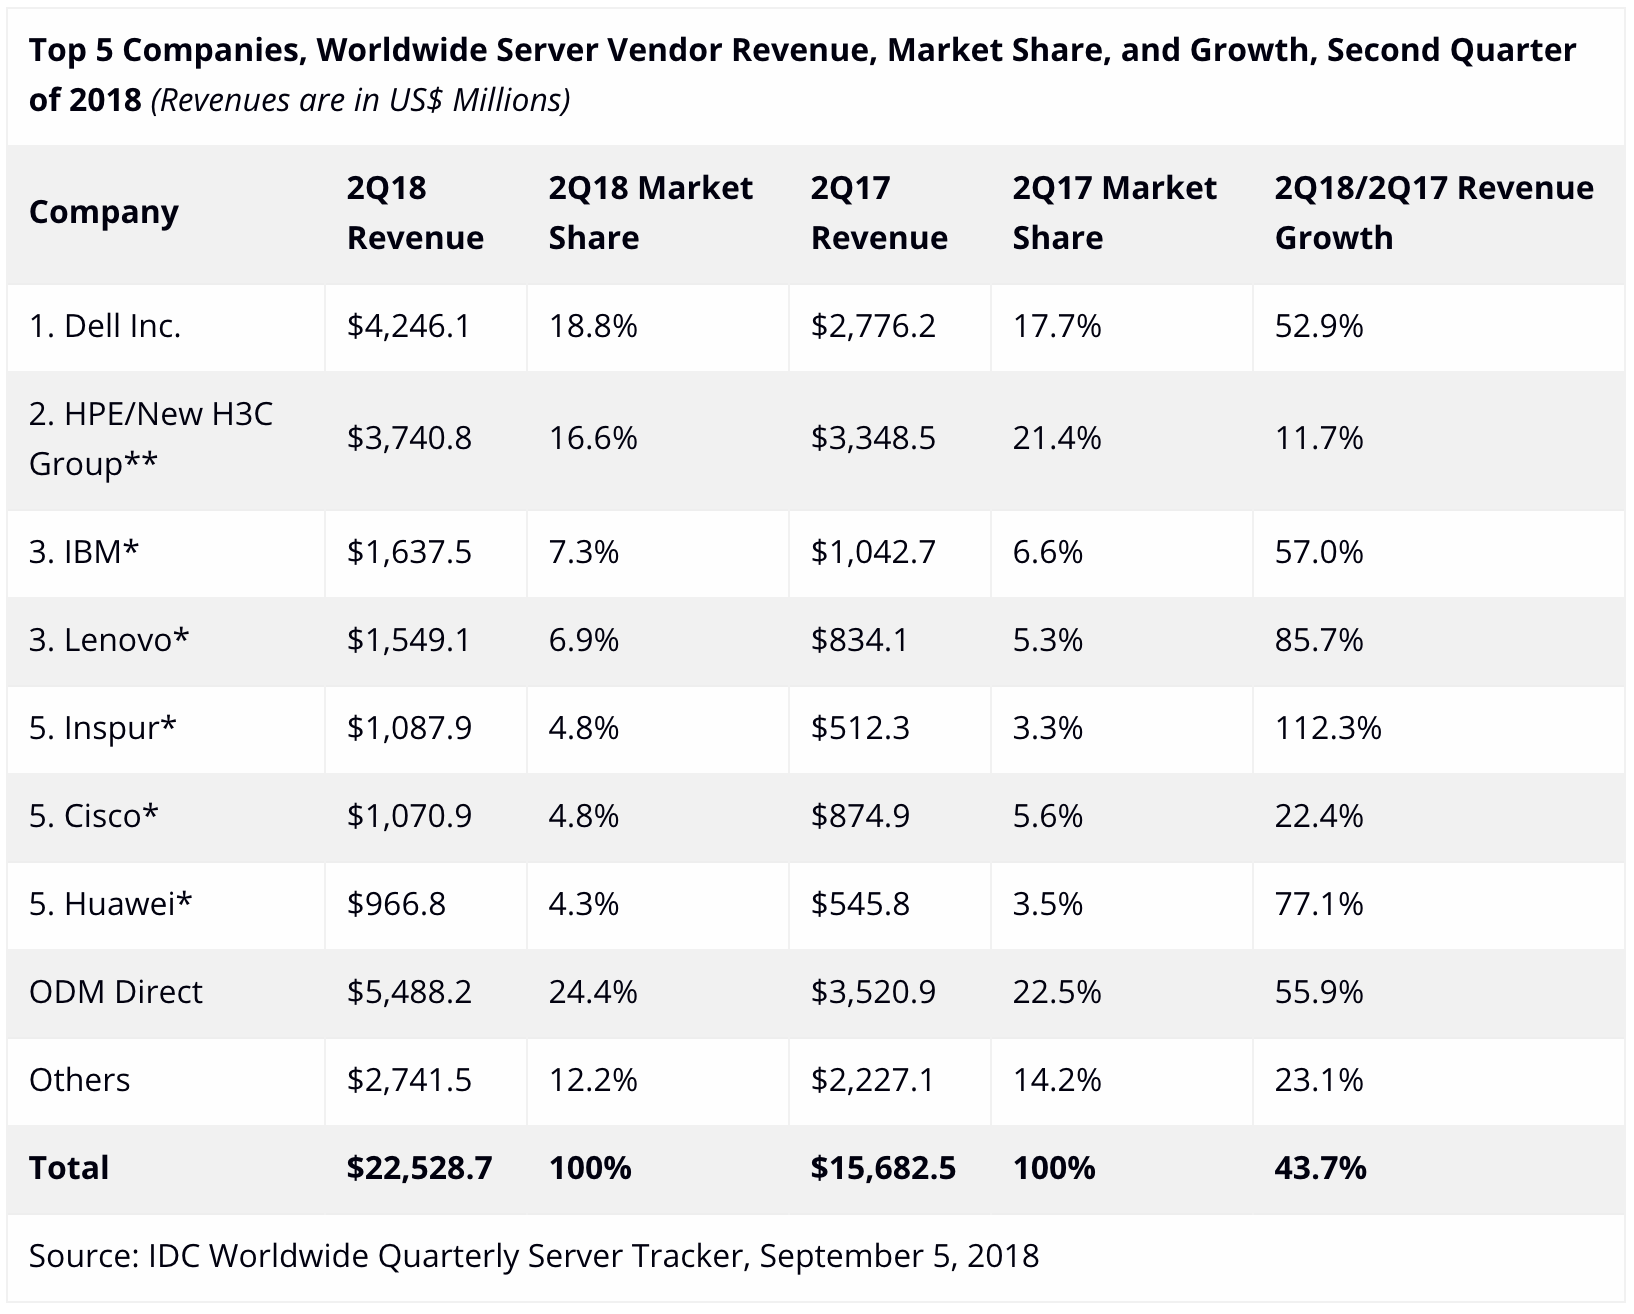
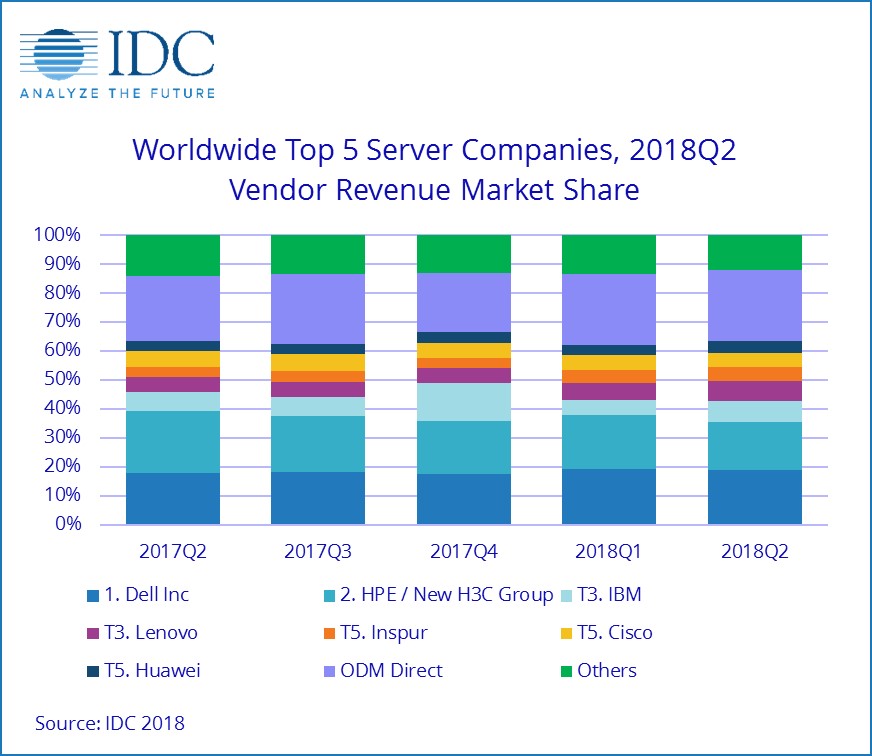
Dell Inc. achieved the number one position in the worldwide server market for the first time in 2Q18 with 18.8% revenue share and 52.9% growth. HPE/New H3C Group was the second largest supplier with 16.6% share of total vendor revenue, growing 11.7%. IBM and Lenovo were statistically tied* for third position in the market with respective shares of 7.3% and 6.9%. Inspur, Cisco, and Huawei rounded out the top five, all statistically tied* with 4.8%, 4.8%, and 4.3% respective shares of vendor revenue. The ODM Direct group of vendors increased its collective revenue by 55.9% (year over year) to $5.5 billion. Dell Inc. led the worldwide server market in terms of unit shipments, accounting for 19.5% of all units shipped during the quarter.
Top 5 Companies, Worldwide Server Vendor Revenue, Market Share, and Growth, Second Quarter of 2018 (Revenues are in US$ Millions)
Notes:
* IDC declares a statistical tie in the worldwide server market when there is a difference of one percent or less in the share of revenues or shipments among two or more vendors.
** Due to the existing joint venture between HPE and the New H3C Group, IDC will be reporting external market share on a global level for HPE and New H3C Group as "HPE/New H3C Group" starting from 2Q 2016 and going forward.
Top 5 Companies, Worldwide Server Unit Shipments, Market Share, and Growth, Second Quarter of 2018 (Shipments are in thousands)

Notes:
* IDC declares a statistical tie in the worldwide server market when there is a difference of one percent or less in the share of revenues or shipments among two or more vendors.
** Due to the existing joint venture between HPE and the New H3C Group, IDC will be reporting external market share on a global level for HPE and New H3C Group as "HPE/New H3C Group" starting from 2Q 2016 and going forward.
Top Server Market Findings
On a geographic basis, Asia/Pacific (excluding Japan) was the fastest growing region in 2Q18 with 55.0% year-over-year revenue growth. The United States grew 48.1%, Latin America grew 47.4%, Europe, the Middle East and Africa (EMEA) grew 28.9%, Canada grew 19.9%, and Japan grew 16.5%. China grew 69.7%.
Demand for x86 servers increased 44.1% in 2Q18 with $20.5 billion in revenues. Non-x86 servers grew 39.8% year over year to $2.1 billion.
IDC's Server Taxonomy
IDC's Server Taxonomy maps the eleven price bands within the server market into three price ranges: volume servers, midrange servers and high-end servers. The revenue data presented in this release is stated as vendor revenue for a server system. IDC presents data in vendor revenue to determine market share position. Vendor revenue represents those dollars recognized by multi-user system and server vendors for ISS (initial server shipment) and upgrade units sold through direct and indirect channels and includes the following embedded server components: Frame or cabinet and all cables, processors, memory, communications boards, operating system software, other bundled software and initial internal and external disk shipments.
IDC's Quarterly Server Tracker is a quantitative tool for analyzing the global server market on a quarterly basis. The Tracker includes quarterly unit shipments and revenues (both vendor revenue and value of shipments), segmented by vendor, family, model, region, operating system, price band, CPU type, and architecture.
Email Newsletters
Sign up to receive TelecomTV's top news and videos, plus exclusive subscriber-only content direct to your inbox.


